## Overview
App performance encompasses various aspects, from raw speed and I/O throughput
to the smoothness of the user interface. While this page primarily focuses on UI
smoothness (lack of stutter or jank), the tools described here can often be used
to diagnose other performance issues as well.
Flutter offers several tools for performance analysis. Here are a few of them:
* **The Performance Overlay**: Displays a simplified set of metrics directly
within your running app. To learn more, see the sections in this topic.
* **The Performance View**: A web-based interface that connects to your app and
displays detailed performance metrics. Part of the DevTools utility. To learn
more, see [Use the Performance View][].
* **Performance tracing within Dart**: Add tracing directly into your app's
Dart code, using the `dart:developer package`, and then track your app's
performance in the DevTools utility. To learn more, see [Tracing Dart code][].
* **Benchmarking**: You can measure and track your app's performance by writing
benchmark tests. The Flutter Driver library provides support
for benchmarking. Using this integration test framework,
you can generate metrics that track jank, download size, battery efficiency,
and startup time. For more information, check out [Integration testing][].
* **Widget rebuild profiler (IntelliJ for Android Studio)**: Jank often arises
from unnecessary UI rebuilds. If you are using IntelliJ for Android Studio,
the Widget Rebuild Profiler helps pinpoint and fix these issues by showing
widget rebuild counts for the current screen and frame. For more information,
see [Show performance data][].
Flutter aims to provide 60 frames per second (fps) performance,
or 120 fps on devices that support it. To achieve the 60fps, each frame must
render approximately every 16ms to avoid jank. Jank occurs when frames take
significantly longer to render and are dropped, resulting in a visible stutter
in animations. For example, if a frame occasionally takes 10 times longer than
usual to render, it will likely be dropped, causing the animation to appear
jerky.
[Use the Performance View]: /tools/devtools/performance
[Tracing Dart code]: /testing/code-debugging#trace-dart-code-performance
[Show performance data]: /tools/android-studio#show-performance-data
[Integration testing]: /testing/integration-tests
## Connect to a physical device
Almost all performance debugging for Flutter applications
should be conducted on a physical Android or iOS device,
with your Flutter application running in [profile mode][].
Using debug mode, or running apps on simulators
or emulators, is generally not indicative of the final
behavior of release mode builds.
_You should consider checking performance
on the slowest device that your users might reasonably use._
:::secondary Why you should run on a real device
* Simulators and emulators don't use the same hardware, so their
performance characteristics are different—some operations are
faster on simulators than real devices, and some are slower.
* Debug mode enables additional checks (such as asserts) that don't run
in profile or release builds, and these checks can be expensive.
* Debug mode also executes code in a different way than release mode.
The debug build compiles the Dart code "just in time" (JIT) as the
app runs, but profile and release builds are pre-compiled to native
instructions (also called "ahead of time", or AOT) before the app is
loaded onto the device. JIT can cause the app to pause for JIT
compilation, which itself can cause jank.
:::
## Run in profile mode
Flutter's profile mode compiles and launches your application
almost identically to release mode, but with just enough additional
functionality to allow debugging performance problems.
For example, profile mode provides tracing information to the
profiling tools.
:::note
Dart/Flutter DevTools can't connect to a
Flutter web app running in profile mode.
Use Chrome DevTools to
[generate timeline events][] for a web app.
:::
Launch the app in profile mode as follows:
* In VS Code, open your `launch.json` file, and set the
`flutterMode` property to `profile`
(when done profiling, change it back to `release` or `debug`):
```json
"configurations": [
{
"name": "Flutter",
"request": "launch",
"type": "dart",
"flutterMode": "profile"
}
]
```
* In Android Studio and IntelliJ, use the
**Run > Flutter Run main.dart in Profile Mode** menu item.
* From the command line, use the `--profile` flag:
```console
$ flutter run --profile
```
For more information on the different modes,
see [Flutter's build modes][].
You'll begin by opening DevTools and viewing
the performance overlay, as discussed in the next section.
[Flutter's build modes]: /testing/build-modes
[generate timeline events]: https://developers.google.com/web/tools/chrome-devtools/evaluate-performance/performance-reference
## Launch DevTools
DevTools provides features like profiling, examining the heap,
displaying code coverage, enabling the performance overlay,
and a step-by-step debugger.
DevTools' [Timeline view][] allows you to investigate the
UI performance of your application on a frame-by-frame basis.
Once your app is running in profile mode,
[launch DevTools][].
[Timeline view]: /tools/devtools/performance
[launch DevTools]: /tools/devtools
## Display the performance overlay {:#displaying-the-performance-overlay}
You can toggle the display of the performance overlay as
follows:
* **DevTools Performance view**: The easiest way to enable the
PerformanceOverlay widget is from the [Performance view][] in [DevTools][].
Simply click the **Performance Overlay** button to toggle the overlay on your
running app.
* **command line**: Toggle the performance overlay using the **P** key from
the command line.
* **programmatically**: To enable the overlay programmatically, see
[Performance overlay][], a section in the
[Debugging Flutter apps programmatically][] page.
[Performance overlay]: /testing/code-debugging#add-performance-overlay
[Debugging Flutter apps programmatically]: /testing/code-debugging
## Observe the performance overlay {:#performance-overlay}
The performance overlay displays statistics in two graphs
that show where time is being spent in your app. If the UI
is janky (skipping frames), these graphs help you figure out why.
The graphs display on top of your running app, but they aren't
drawn like a normal widget—the Flutter engine itself
paints the overlay and only minimally impacts performance.
Each graph represents the last 300 frames for that thread.
This section describes how to enable the performance overlay
and use it to diagnose the cause of jank in your application.
The following screenshot shows the performance overlay running
on the Flutter Gallery example:
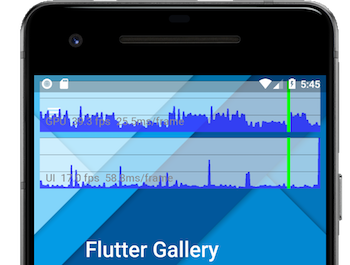
Performance overlay showing the raster thread (top),
and UI thread (bottom).
The vertical green bars
represent the current frame.
### Review the graphs {:#interpreting-the-graphs}
The top graph (marked "GPU") shows the time spent by
the raster thread, the bottom one graph shows the time
spent by the UI thread.
The white lines across the graphs show 16ms increments
along the vertical axis; if the graph ever goes over one
of these lines then you are running at less than 60Hz.
The horizontal axis represents frames. The graph is
only updated when your application paints,
so if it's idle the graph stops moving.
The overlay should always be viewed in [profile mode][],
since [debug mode][] performance is intentionally sacrificed
in exchange for expensive asserts that are intended to aid
development, and thus the results are misleading.
Each frame should be created and displayed within 1/60th of
a second (approximately 16ms). A frame exceeding this limit
(in either graph) fails to display, resulting in jank,
and a vertical red bar appears in one or both of the graphs.
If a red bar appears in the UI graph, the Dart code is too
expensive. If a red vertical bar appears in the GPU graph,
the scene is too complicated to render quickly.
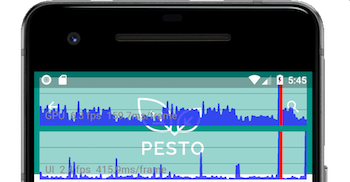
The vertical red bars indicate that the current frame is
expensive to both render and paint.
When both graphs
display red, start by diagnosing the UI thread.
### Review the threads {:#flutters-threads}
Flutter uses several threads to do its work, though
only two of the threads are shown in the overlay.
All of your Dart code runs on the UI thread.
Although you have no direct access to any other thread,
your actions on the UI thread have performance consequences
on other threads.
**Platform thread**
: The platform's main thread. Plugin code runs here.
For more information, see the [UIKit][] documentation for iOS,
or the [MainThread][] documentation for Android.
_This thread is not shown in the performance overlay._
**UI thread**
: The UI thread executes Dart code in the Dart VM.
This thread includes code that you wrote, and code executed by
Flutter's framework on your app's behalf.
When your app creates and displays a scene, the UI thread creates
a _layer tree_, a lightweight object containing device-agnostic
painting commands, and sends the layer tree to the raster thread to
be rendered on the device. _Don't block this thread!_
Shown in the bottom row of the performance overlay.
**Raster thread**
: The raster thread takes the layer tree and displays
it by talking to the GPU (graphic processing unit).
You cannot directly access the raster thread or its data but,
if this thread is slow, it's a result of something you've done
in the Dart code. Skia and Impeller, the graphics libraries,
run on this thread.
Shown in the top row of the performance overlay.
Note that while the raster thread rasterizes for the GPU,
the thread itself runs on the CPU.
**I/O thread**
: Performs expensive tasks (mostly I/O) that would
otherwise block either the UI or raster threads.
_This thread is not shown in the performance overlay._
For links to more information and videos,
see [The Framework architecture][] in the
[Flutter wiki][], and the community article,
[The Layer Cake][].
[debug mode]: /testing/build-modes#debug
[Flutter wiki]: https://github.com/flutter/flutter/tree/main/docs
[UIKit]: https://developer.apple.com/documentation/uikit
[The Layer Cake]: https://medium.com/flutter-community/the-layer-cake-widgets-elements-renderobjects-7644c3142401
[The Framework architecture]: https://github.com/flutter/flutter/blob/main/docs/about/The-Framework-architecture.md
[MainThread]: https://developer.android.com/reference/android/support/annotation/MainThread
## Identify problems
### Review the UI graph {:#identifying-problems-in-the-ui-graph}
If the performance overlay shows red in the UI graph,
start by profiling the Dart VM, even if the GPU graph
also shows red.
### Review the GPU graph {:#identifying-problems-in-the-gpu-graph}
Sometimes a scene results in a layer tree that is easy to construct,
but expensive to render on the raster thread. When this happens,
the UI graph has no red, but the GPU graph shows red.
In this case, you'll need to figure out what your code is doing
that is causing rendering code to be slow. Specific kinds of workloads
are more difficult for the GPU. They might involve unnecessary calls
to [`saveLayer`][], intersecting opacities with multiple objects,
and clips or shadows in specific situations.
If you suspect that the source of the slowness is during an animation,
click the **Slow Animations** button in the Flutter inspector
to slow animations down by 5x.
If you want more control on the speed, you can also do this
[programmatically][].
Is the slowness on the first frame, or on the whole animation?
If it's the whole animation, is clipping causing the slow down?
Maybe there's an alternative way of drawing the scene that doesn't
use clipping. For example, overlay opaque corners onto a square
instead of clipping to a rounded rectangle.
If it's a static scene that's being faded, rotated, or otherwise
manipulated, a [`RepaintBoundary`][] might help.
[programmatically]: /testing/code-debugging#debug-animation-issues
#### Checking for offscreen layers
The [`saveLayer`][] method is one of the most expensive methods in
the Flutter framework. It's useful when applying post-processing
to the scene, but it can slow your app and should be avoided if
you don't need it. Even if you don't call `saveLayer` explicitly,
implicit calls might happen on your behalf, for example when specifying
[`Clip.antiAliasWithSaveLayer`][] (typically as a `clipBehavior`).
For example,
perhaps you have a group of objects with opacities that are rendered
using `saveLayer`. In this case, it's probably more performant to
apply an opacity to each individual widget, rather than a parent
widget higher up in the widget tree. The same goes for
other potentially expensive operations, such as clipping or shadows.
:::note
Opacity, clipping, and shadows are not, in themselves,
a bad idea. However, applying them to the top of the
widget tree might cause extra calls to `saveLayer`,
and needless processing.
:::
When you encounter calls to `saveLayer`,
ask yourself these questions:
* Does the app need this effect?
* Can any of these calls be eliminated?
* Can I apply the same effect to an individual element instead of a group?
[`Clip.antiAliasWithSaveLayer`]: https://api.flutter.dev/flutter/dart-ui/Clip.html
#### Checking for non-cached images
Caching an image with [`RepaintBoundary`][] is good,
_when it makes sense_.
One of the most expensive operations,
from a resource perspective,
is rendering a texture using an image file.
First, the compressed image
is fetched from persistent storage.
The image is decompressed into host memory (GPU memory),
and transferred to device memory (RAM).
In other words, image I/O can be expensive.
The cache provides snapshots of complex hierarchies so
they are easier to render in subsequent frames.
_Because raster cache entries are expensive to
construct and take up loads of GPU memory,
cache images only where absolutely necessary._
## Other resources
The following resources provide more information on using
Flutter's tools and debugging in Flutter:
* [Debugging][]
* [Performance view][]
* [Flutter inspector][]
* [Flutter inspector talk][], presented at DartConf 2018
* [Why Flutter Uses Dart][], an article on Hackernoon
* [Why Flutter uses Dart][video], a video on the Flutter channel
* [DevTools][devtools]: performance tooling for Dart and Flutter apps
* [Flutter API][] docs, particularly the [`PerformanceOverlay`][] class,
and the [dart:developer][] package
[`PerformanceOverlay`]: https://api.flutter.dev/flutter/widgets/PerformanceOverlay-class.html
[`RepaintBoundary`]: https://api.flutter.dev/flutter/widgets/RepaintBoundary-class.html
[`saveLayer`]: https://api.flutter.dev/flutter/dart-ui/Canvas/saveLayer.html
[dart:developer]: https://api.flutter.dev/flutter/dart-developer/dart-developer-library.html
[Debugging]: /testing/debugging
[devtools]: /tools/devtools
[Flutter API]: https://api.flutter.dev
[Flutter inspector talk]: https://www.youtube.com/watch?v=JIcmJNT9DNI
[Flutter inspector]: /tools/devtools/inspector
[Performance view]: /tools/devtools/performance
[profile mode]: /testing/build-modes#profile
[video]: https://www.youtube.com/watch?v=5F-6n_2XWR8
[Why Flutter Uses Dart]: https://hackernoon.com/why-flutter-uses-dart-dd635a054ebf