Use the Network View
What is it?
#The network view allows you to inspect HTTP, HTTPS, and WebSocket traffic from your Dart or Flutter application.
What network traffic is recorded?
#All network traffic that originates from dart:io (like the HttpClient class) is logged, including the dio package. Also all network traffic that is logged using the http_profile package is recorded in the network request table. This includes network traffic from the cupertino_http, cronet_http, and ok_http packages.
For a web app that makes requests using the browser, we recommend using browser tools to inspect network traffic, such as Chrome DevTools.
How to use it
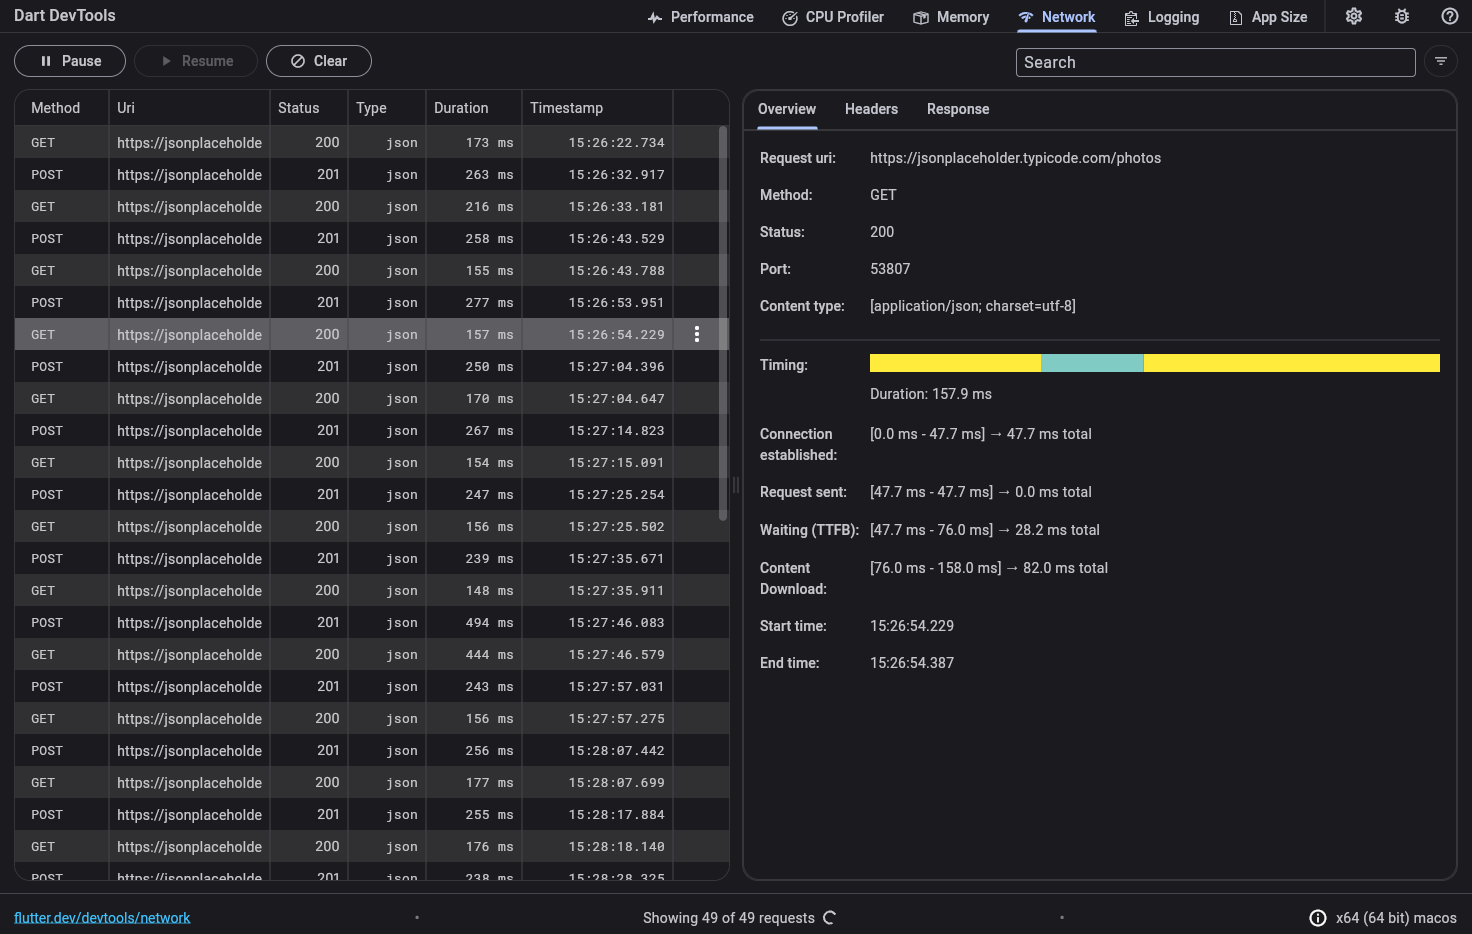
#When you open the Network page, DevTools immediately starts recording network traffic. To pause and resume recording, use the Pause and Resume buttons (upper left).
When a network request is sent by your app, it appears in the network request table (left). It's listed as "Pending" until a complete response is received.
Select a network request from the table (left) to view details (right). You can inspect general and timing information about the request, as well as the content of response and request headers and bodies. Some data is not available until the response is received.
Search and filtering
#You can use the search and filter controls to find a specific request or filter requests out of the request table.

To apply a filter, press the filter button (right of the search bar). You will see a filter dialog pop up:
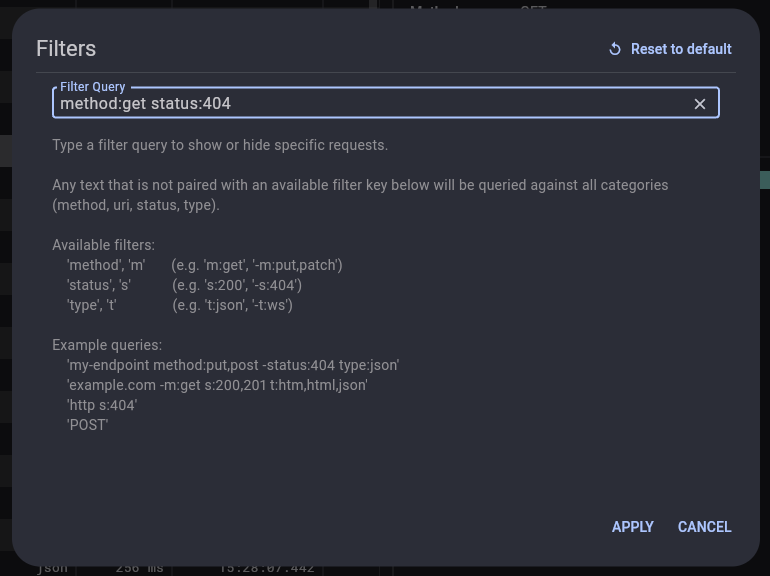
The filter query syntax is described in the dialog. You can filter network requests by the following keys:
method,m: this filter corresponds to the value in the "Method" columnstatus,s: this filter corresponds to the value in the "Status" columntype,t: this filter corresponds to the value in the "Type" column
Any text that is not paired with an available filter key will be queried against all categories (method, URI, status, type).
Example filter queries:
my-endpoint m:get t:json s:200https s:404Recording network requests on app startup
#To record network traffic on app startup, you can start your app in a paused state, and then begin recording network traffic in DevTools before resuming your app.
- Start your app in a paused state:
flutter run --start-paused ...dart run --pause-isolates-on-start --observe ...
- Open DevTools from the IDE where you started your app, or from the link that was printed to the command line if you started your app from the CLI.
- Navigate to the Network screen and ensure that recording has started.
- Resume your app.
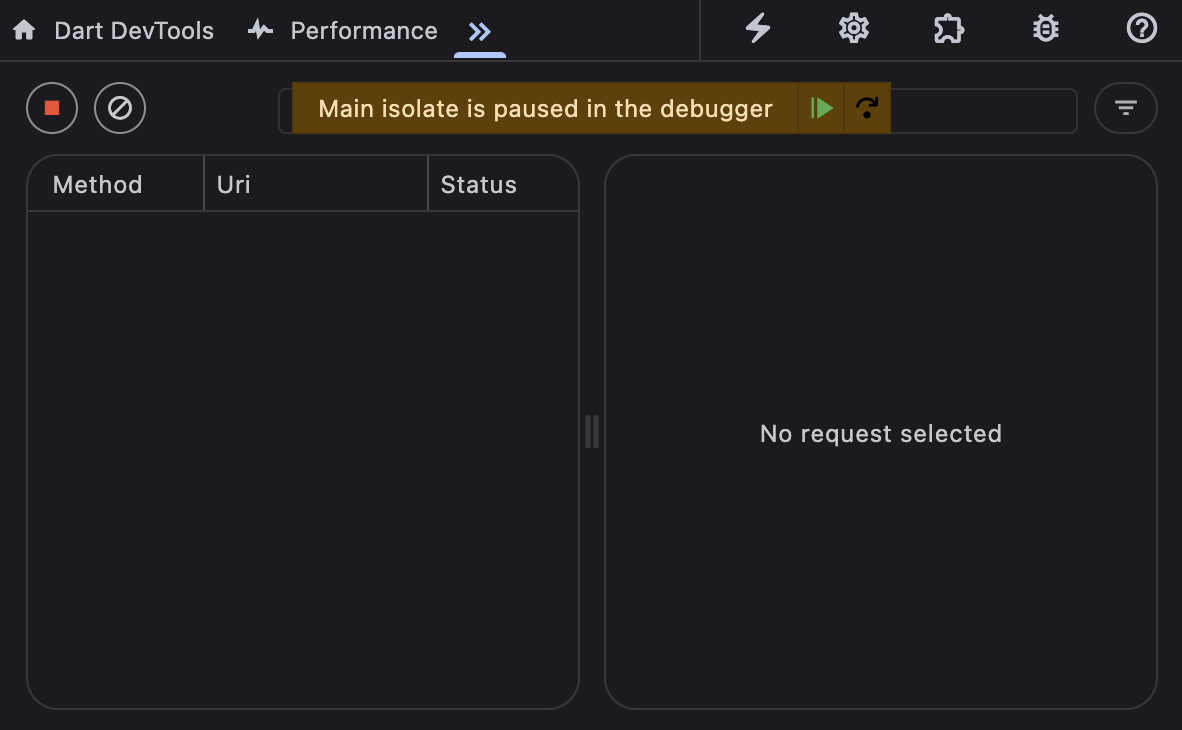
- The Network profiler will now record all network traffic from your app, including traffic from app startup.
Other resources
#HTTP and HTTPS requests are also surfaced in the Timeline as asynchronous timeline events. Viewing network activity in the timeline can be useful if you want to see how HTTP traffic aligns with other events happening in your app or in the Flutter framework.
To learn how to monitor an app's network traffic and inspect different types of requests using the DevTools, check out a guided Network View tutorial. The tutorial also uses the view to identify network activity that causes poor app performance.
Unless stated otherwise, the documentation on this site reflects the latest stable version of Flutter. Page last updated on 2025-04-28. View source or report an issue.