Use the Performance view
Learn how to use the DevTools performance view.
The performance page can help you diagnose performance problems and UI jank in your application. This page offers timing and performance information for activity in your application. It consists of several tools to help you identify the cause of poor performance in your app:
- Flutter frames chart (Flutter apps only)
- Frame analysis tab (Flutter apps only)
- Timeline events trace viewer (all native Dart applications)
- Advanced debugging tools (Flutter apps only)
The performance view also supports importing and exporting of data snapshots. For more information, check out the Import and export section.
What is a frame in Flutter?
#Flutter is designed to render its UI at 60 frames per second (fps), or 120 fps on devices capable of 120Hz updates. Each render is called a frame. This means that, approximately every 16ms, the UI updates to reflect animations or other changes to the UI. A frame that takes longer than 16ms to render causes jank (jerky motion) on the display device.
Flutter frames chart
#This chart contains Flutter frame information for your application. Each bar set in the chart represents a single Flutter frame. The bars are color-coded to highlight the different portions of work that occur when rendering a Flutter frame: work from the UI thread and work from the raster thread.
This chart contains Flutter frame timing information for your application. Each pair of bars in the chart represents a single Flutter frame. Selecting a frame from this chart updates the data that is displayed below in the Frame analysis tab or the Timeline events tab.
The flutter frames chart updates when new frames are drawn in your app. To pause updates to this chart, click the pause button to the right of the chart. This chart can be collapsed to provide more viewing space for data below by clicking the Flutter frames button above the chart.
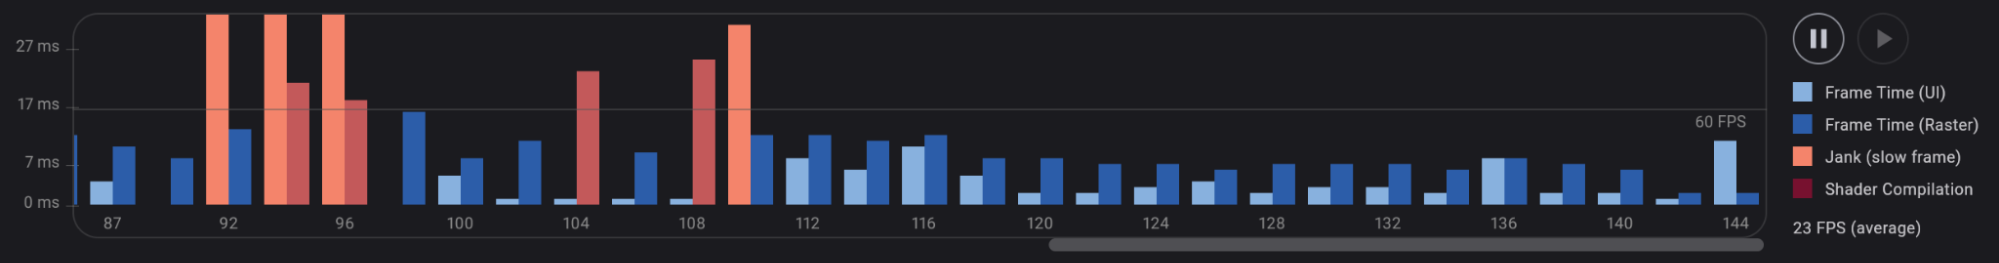
The pair of bars representing each Flutter frame are color-coded to highlight the different portions of work that occur when rendering a Flutter frame: work from the UI thread and work from the raster thread.
UI
#The UI thread executes Dart code in the Dart VM. This includes code from your application as well as the Flutter framework. When your app creates and displays a scene, the UI thread creates a layer tree, a lightweight object containing device-agnostic painting commands, and sends the layer tree to the raster thread to be rendered on the device. Do not block this thread.
Raster
#The raster thread executes graphics code from the Flutter Engine. This thread takes the layer tree and displays it by talking to the GPU (graphic processing unit). You can't directly access the raster thread or its data, but if this thread is slow, it's a result of something you've done in the Dart code. Skia, the graphics library, runs on this thread. Impeller also uses this thread.
Sometimes a scene results in a layer tree that is easy to construct,
but expensive to render on the raster thread. In this case, you
need to figure out what your code is doing that is causing
rendering code to be slow. Specific kinds of workloads are more
difficult for the GPU. They might involve unnecessary calls to
saveLayer(), intersecting opacities with multiple objects,
and clips or shadows in specific situations.
For more information on profiling, check out Identifying problems in the GPU graph.
Jank (slow frame)
#The frame rendering chart shows jank with a red overlay. A frame is considered to be janky if it takes more than ~16 ms to complete (for 60 FPS devices). To achieve a frame rendering rate of 60 FPS (frames per second), each frame must render in ~16 ms or less. When this target is missed, you may experience UI jank or dropped frames.
For more information on how to analyze your app's performance, check out Flutter performance profiling.
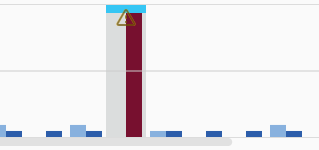
Shader compilation
#Shader compilation occurs when a shader is first used in your Flutter app. Frames that perform shader compilation are marked in dark red:
For more information on how to reduce shader compilation jank, check out Reduce shader compilation jank on mobile.
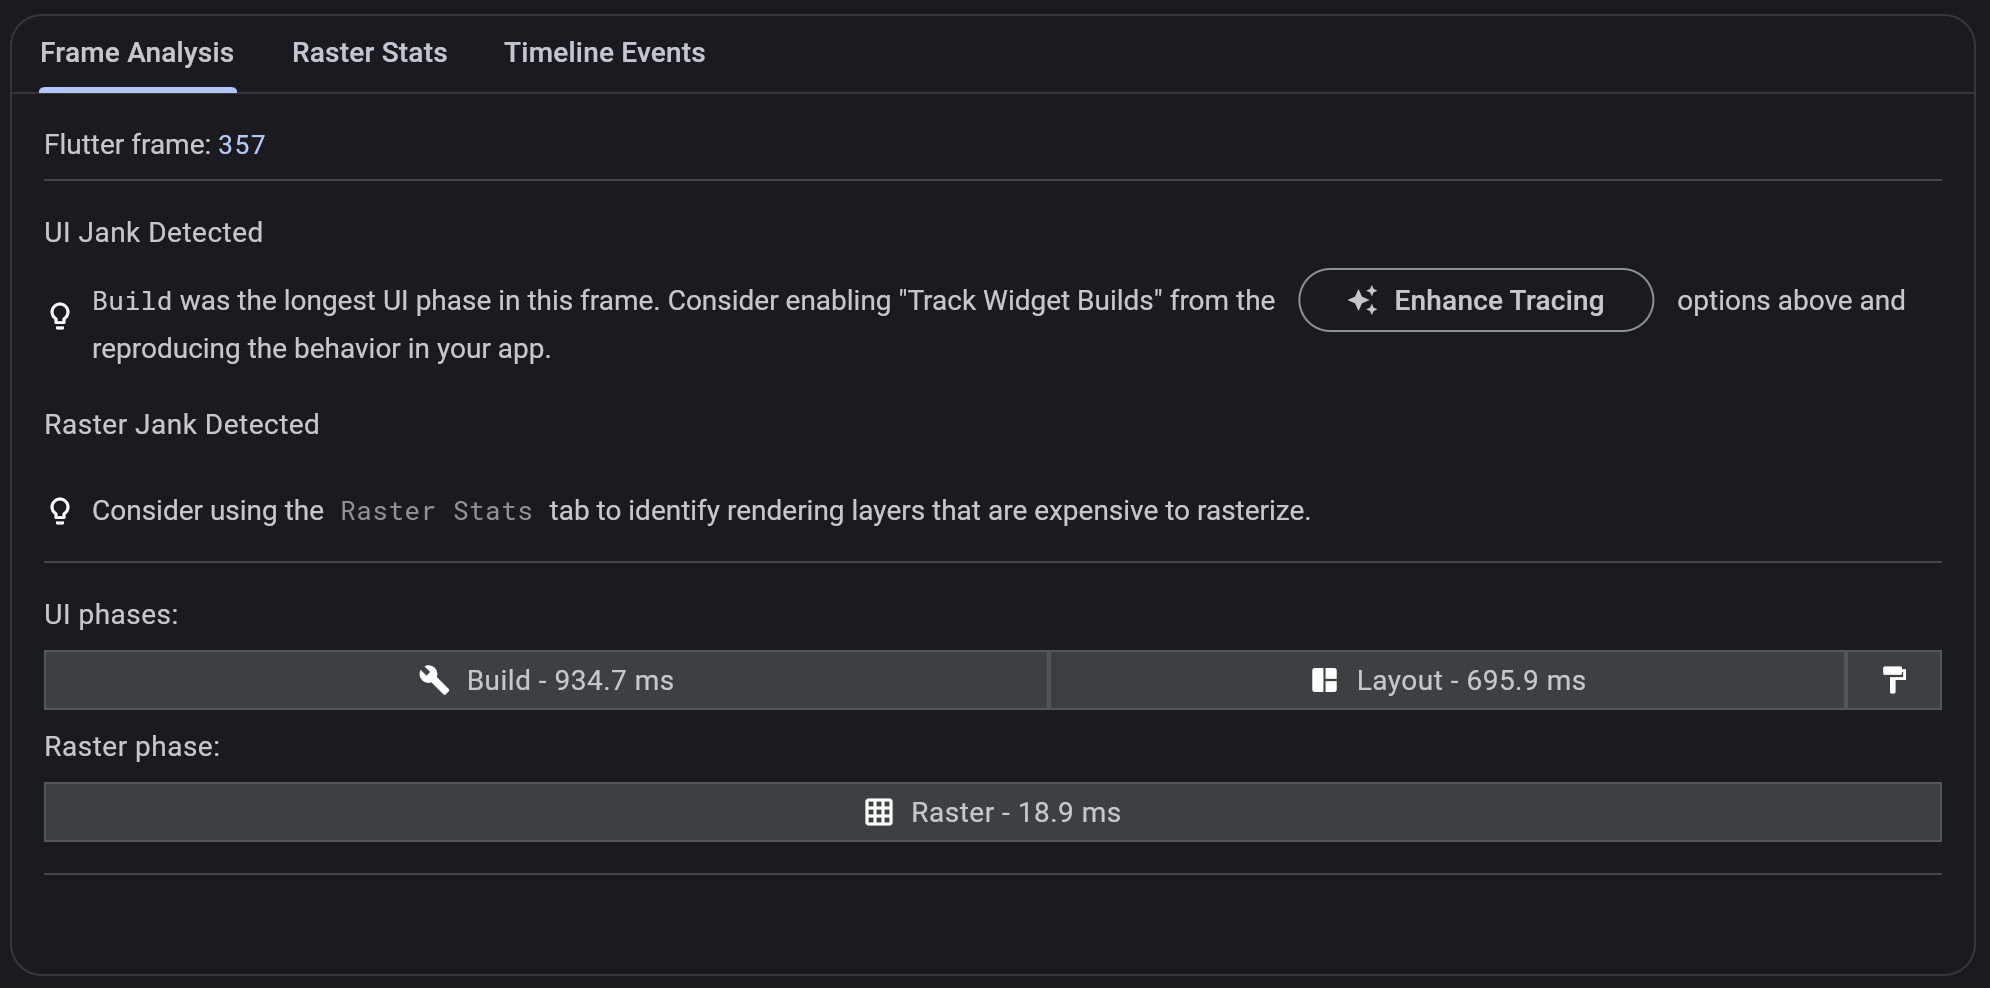
Frame analysis tab
#Selecting a janky frame (slow, colored in red) from the Flutter frames chart above shows debugging hints in the Frame analysis tab. These hints help you diagnose jank in your app, and notify you of any expensive operations that we have detected that might have contributed to the slow frame time.
Timeline events tab
#
The timeline events chart shows all event tracing from your application.
The Flutter framework emits timeline events as it works to build frames,
draw scenes, and track other activity such as HTTP request timings
and garbage collection. These events show up here in the Timeline.
You can also send your own Timeline events using the dart:developer
Timeline
and TimelineTask
APIs.
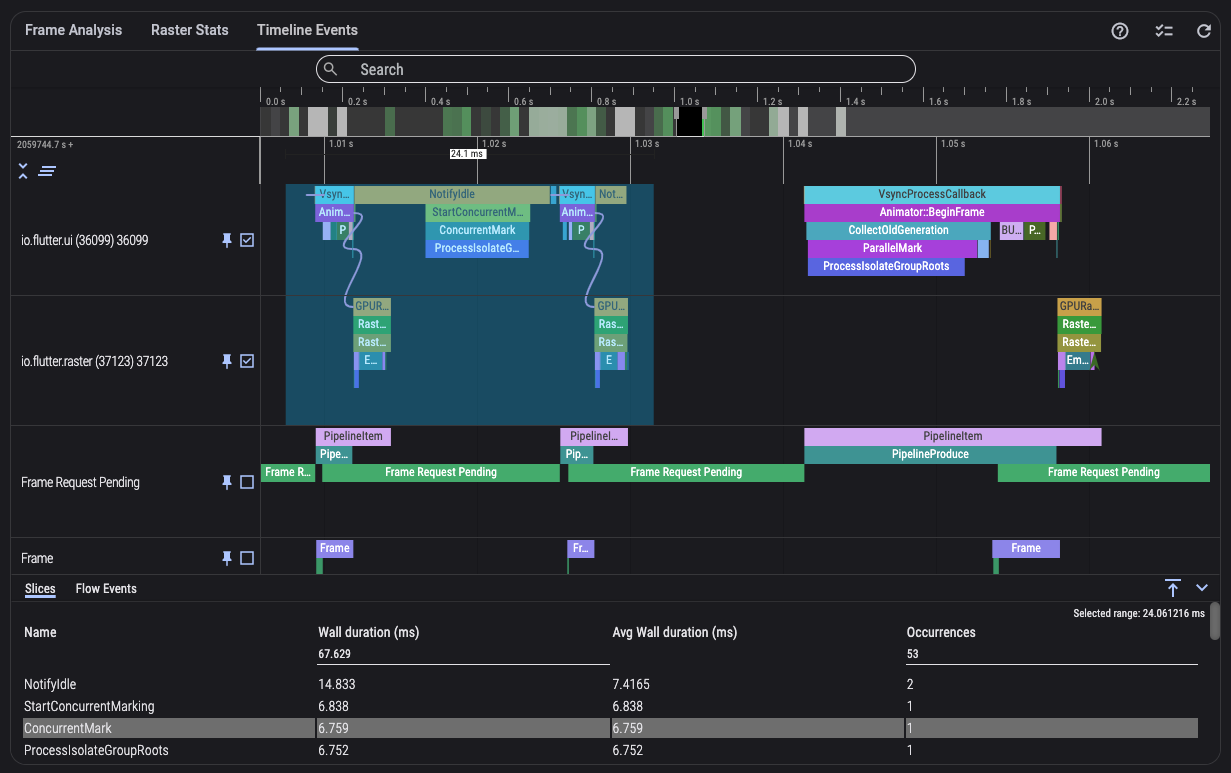 For help with navigating and using the trace viewer,
click the ? button at the top right of the timeline
events tab bar. To refresh the timeline with new events from
your application, click the refresh button
(also in the upper right corner of the tab controls).
For help with navigating and using the trace viewer,
click the ? button at the top right of the timeline
events tab bar. To refresh the timeline with new events from
your application, click the refresh button
(also in the upper right corner of the tab controls).
Advanced debugging tools
#Enhance tracing
#To view more detailed tracing in the timeline events chart, use the options in the enhance tracing dropdown:
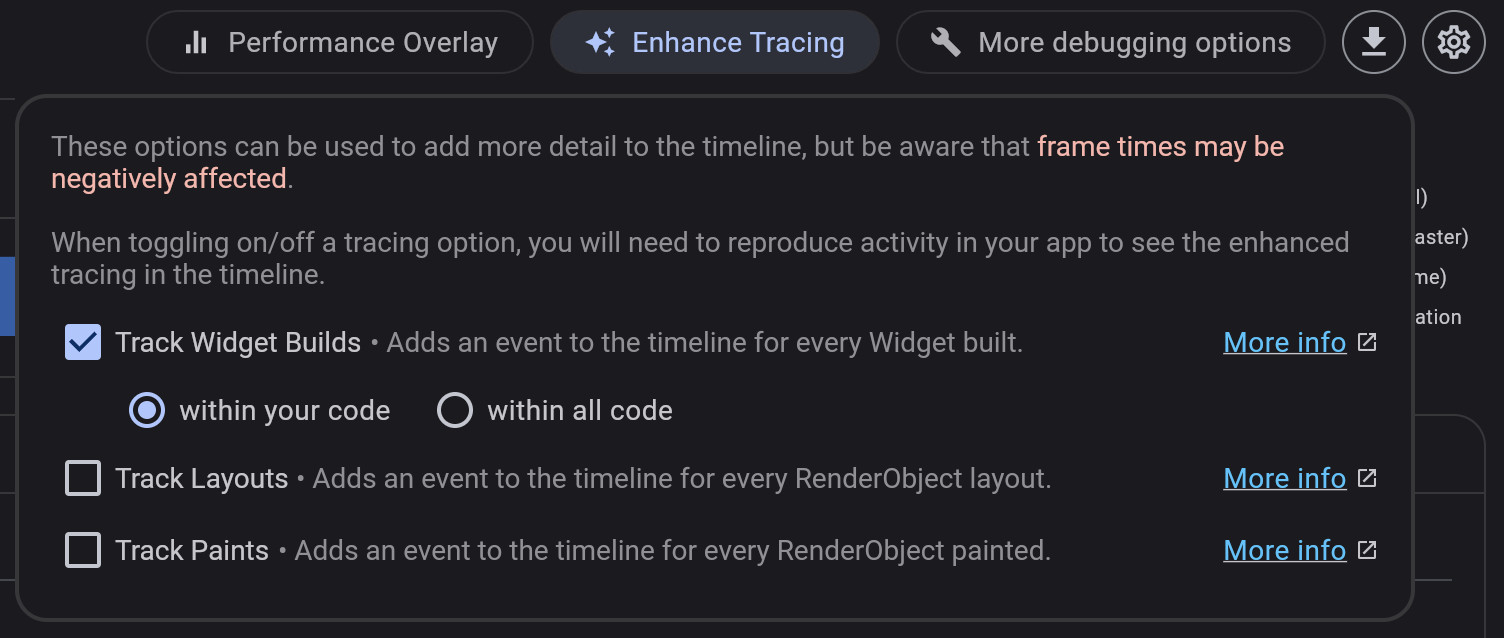
To see the new timeline events, reproduce the activity in your app that you are interested in tracing, and then select a frame to inspect the timeline.
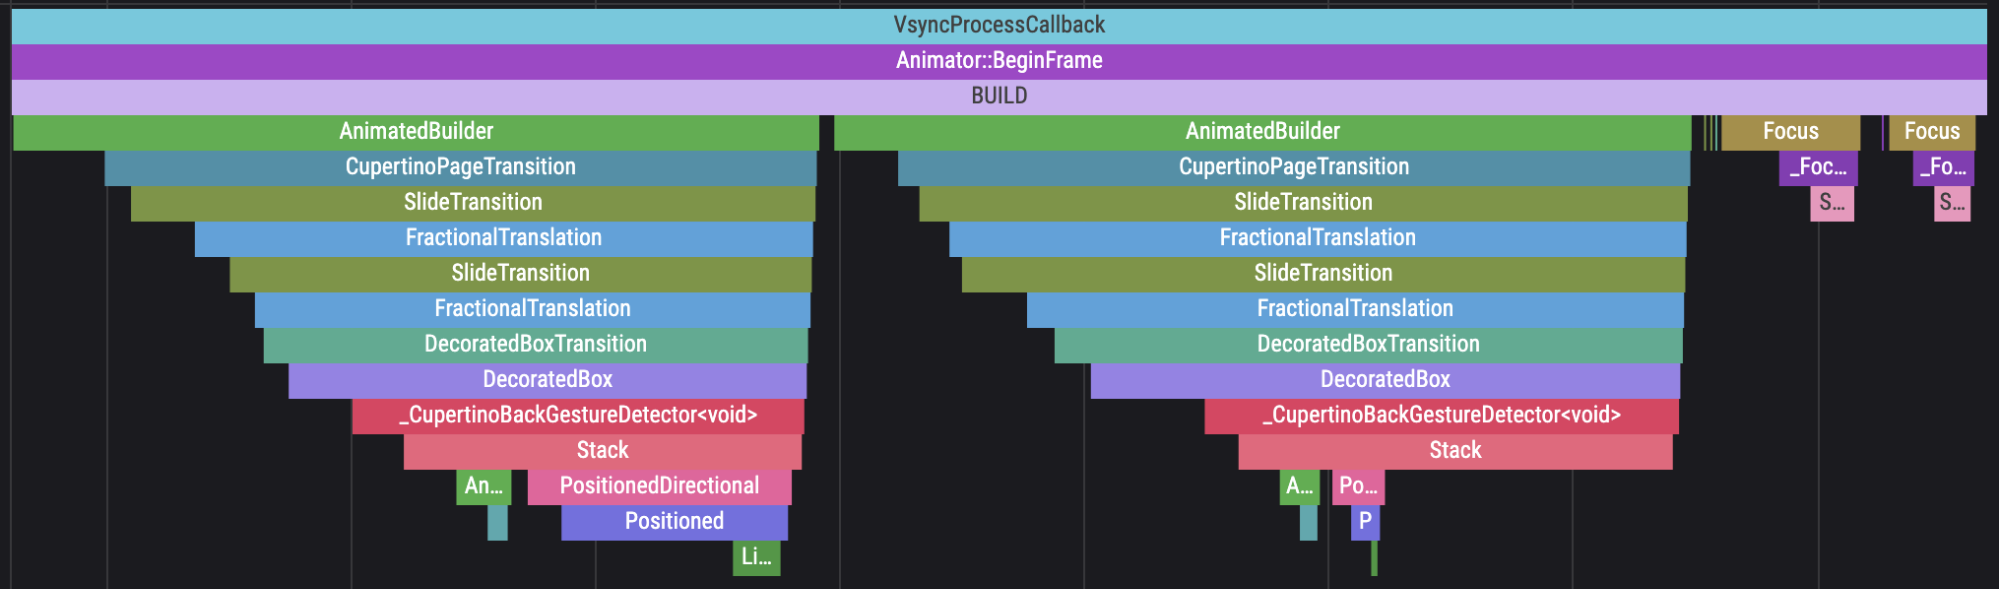
Track widget builds
#
To see the build() method events in the timeline,
enable the Track Widget Builds option.
The name of the widget is shown in the timeline event.
Watch this video for an example of tracking widget builds
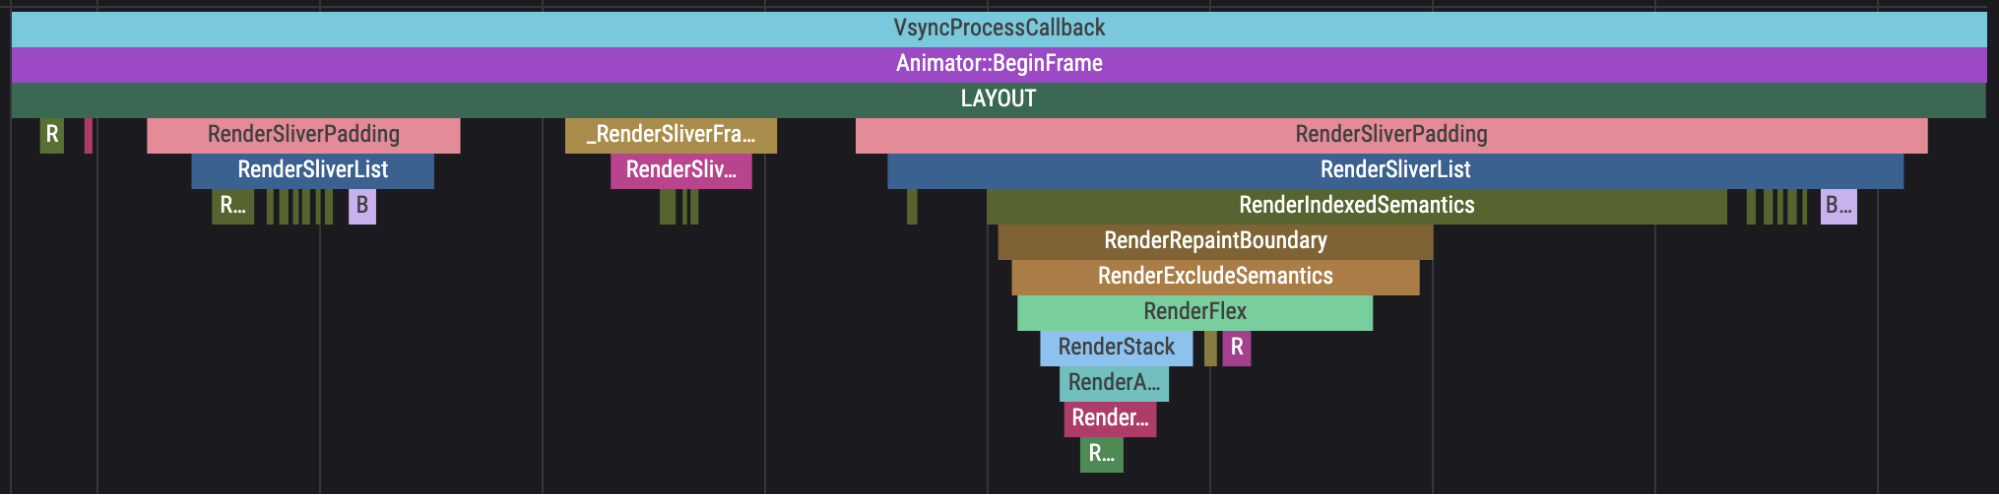
Track layouts
#To see render object layout events in the timeline, enable the Track Layouts option:
Watch this video for an example of tracking layouts
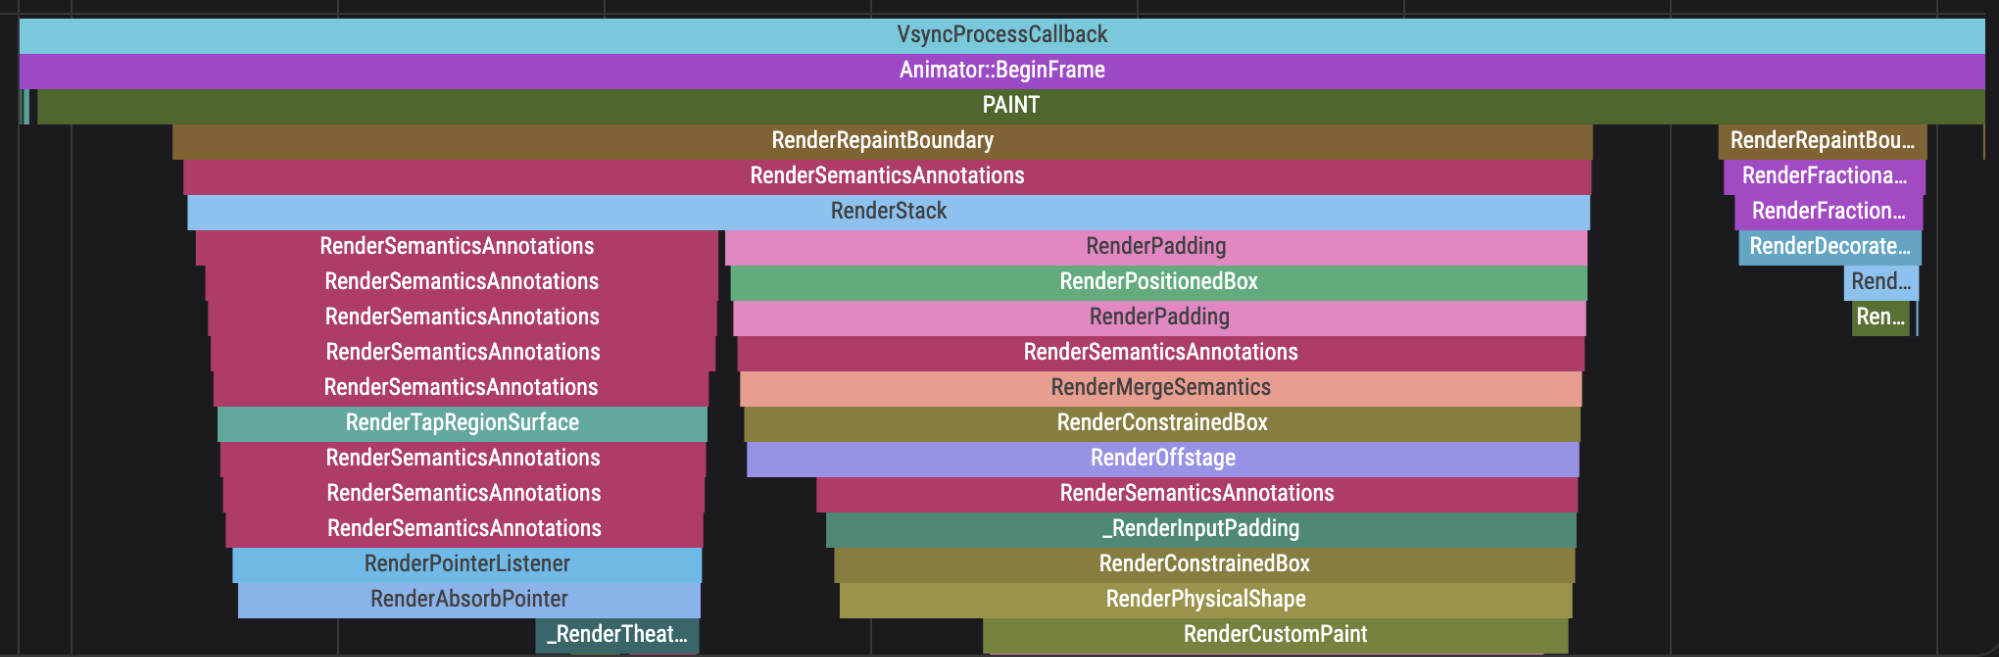
Track paints
#To see render object paint events in the timeline, enable the Track Paints option:
Watch this video for an example of tracking paints
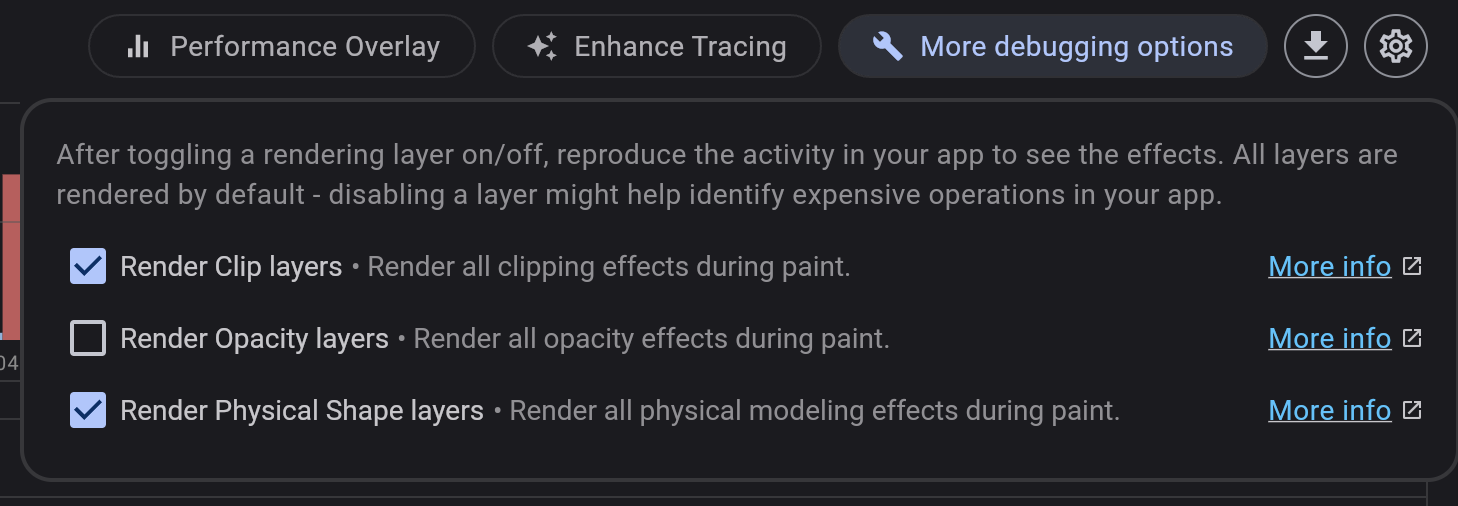
More debugging options
#To diagnose performance problems related to rendering layers, toggle off a rendering layer. These options are enabled by default.
To see the effects on your app's performance, reproduce the activity in your app. Then select the new frames in the frames chart to inspect the timeline events with the layers disabled. If raster time has significantly decreased, excessive use of the effects you disabled might be contributing to the jank you saw in your app.
- Render Clip layers
-
Disable this option to check whether excessive use of clipping is affecting performance. If performance improves with this option disabled, try to reduce the use of clipping effects in your app.
- Render Opacity layers
-
Disable this option to check whether excessive use of opacity effects are affecting performance. If performance improves with this option disabled, try to reduce the use of opacity effects in your app.
- Render Physical Shape layers
-
Disable this option to check whether excessive use of physical modeling effects are affecting performance, such as shadows or elevation. If performance improves with this option disabled, try to reduce the use of physical modeling effects in your app.
Import and export
#DevTools supports importing and exporting performance snapshots. Clicking the export button (upper-right corner above the frame rendering chart) downloads a snapshot of the current data on the performance page. To import a performance snapshot, you can drag and drop the snapshot into DevTools from any page. Note that DevTools only supports importing files that were originally exported from DevTools.
Other resources
#To learn how to monitor an app's performance and detect jank using DevTools, check out a guided Performance View tutorial.
Unless stated otherwise, the documentation on this site reflects Flutter 3.44.7. Page last updated on 2026-05-05. View source or report an issue.